Simulation: December 16, 2024
Output dashboard split view

The output dashboard is now split into two tabs: one tab for the data that is sampled across all runs (Statistical), and one tab with the data from a specific run picked based on the duration of the run or task group of the run (Run-specific).
This feature is only used for construction cases for now, which use specific runs to display timeline data (S-curve and inventory stock levels).
Sort run-based data by project or task group
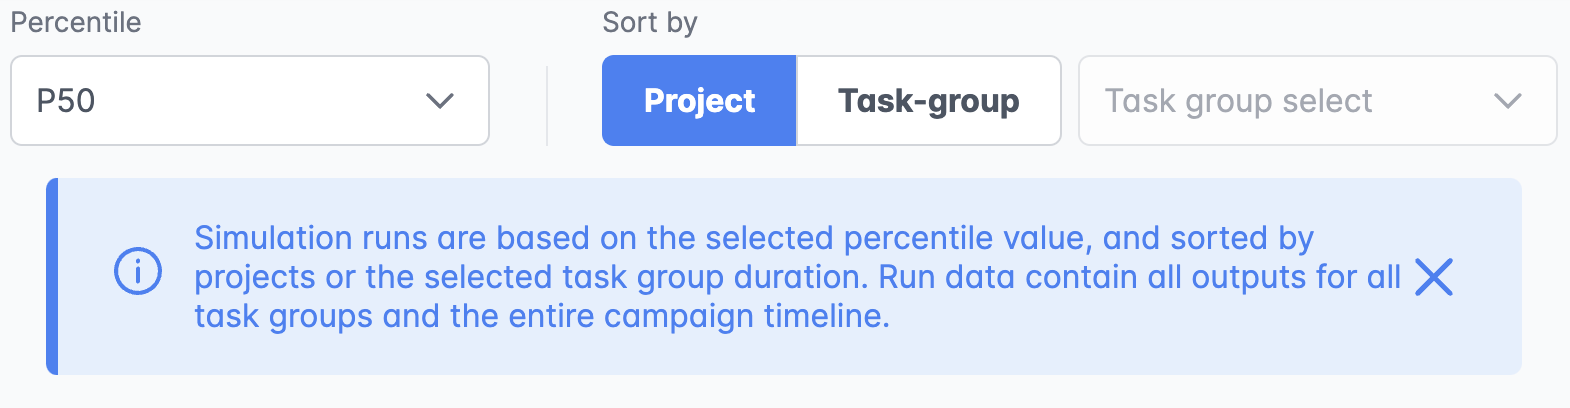
For run-based data, you can choose how the runs are sorted. By default, runs are ranked based on the duration of the whole project (Project option). But you can chose to rank runs based on the end date of any of the tasks you add to your assets in the case (Task group option).
Example
In a project with installation and commissioning, you can rank runs based on installation end date instead of the project end date, which is when the last commissioning task is done.
View output dashboard graph explanations
Each graph in the output dashboard has an info button which explains what the graph displays.